
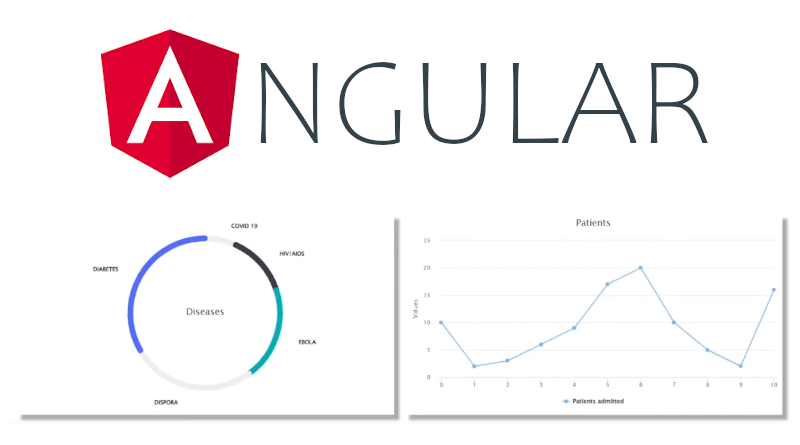
Creare grafici in Angular CLI con Angular Highcharts
Come prima azione occorre installare Angular Highcharts, le informazioni sono nella pagina alla seguente URL:
https://www.npmjs.com/package/angular-highcharts
In sostanza occorre effettuare l’installazione con il comando
npm i angular-highcharts highchartsN.B. ho aggiunto highcharts per installare angular-highcharts e highcharts
Una volta effettuata l’installazione occorre importare il modulo installato inserendo i riferimenti nel file app.module.ts:
// app.module.ts
import { ChartModule } from 'angular-highcharts';

@NgModule({
  imports: [
    ChartModule // add ChartModule to your imports
  ]
})
export class AppModule {}
Per l’utilizzo qui di seguito un esempio:
// chart.component.ts
import { Chart } from 'angular-highcharts';

@Component({
  template: `
    <button (click)="add()">Add Point!</button>
    <div [chart]="chart"></div>
  `
})
export class ChartComponent {
  chart = new Chart({
    chart: {
      type: 'line'
    },
    title: {
      text: 'Linechart'
    },
    credits: {
      enabled: false
    },
    series: [
      {
        name: 'Line 1',
        data: [1, 2, 3]
      }
    ]
  });

  // add point to chart serie
  add() {
    this.chart.addPoint(Math.floor(Math.random() * 10));
  }
}


I think that what you composed was actually very logical.
However, consider this, suppose you typed a catchier title?
I ain’t suggesting your information is not good., but what if you
added a headline that grabbed a person’s attention? I
mean Creare grafici in Angular CLI con Angular Highcharts – papadia.org is
a little vanilla. You should glance at Yahoo’s front page and see how they create post
titles to get viewers to click. You might add a video or a related pic
or two to grab people interested about what you’ve got to say.
In my opinion, it could bring your blog a little bit more interesting.
Nice share!